Admin Dashboard
The Admin Dashboard gives admins a centralized view of enterprise activity and performance.
Overview: What This Page Offers
From this page, admins can quickly understand adoption, usage patterns, and agent performance across the organization.
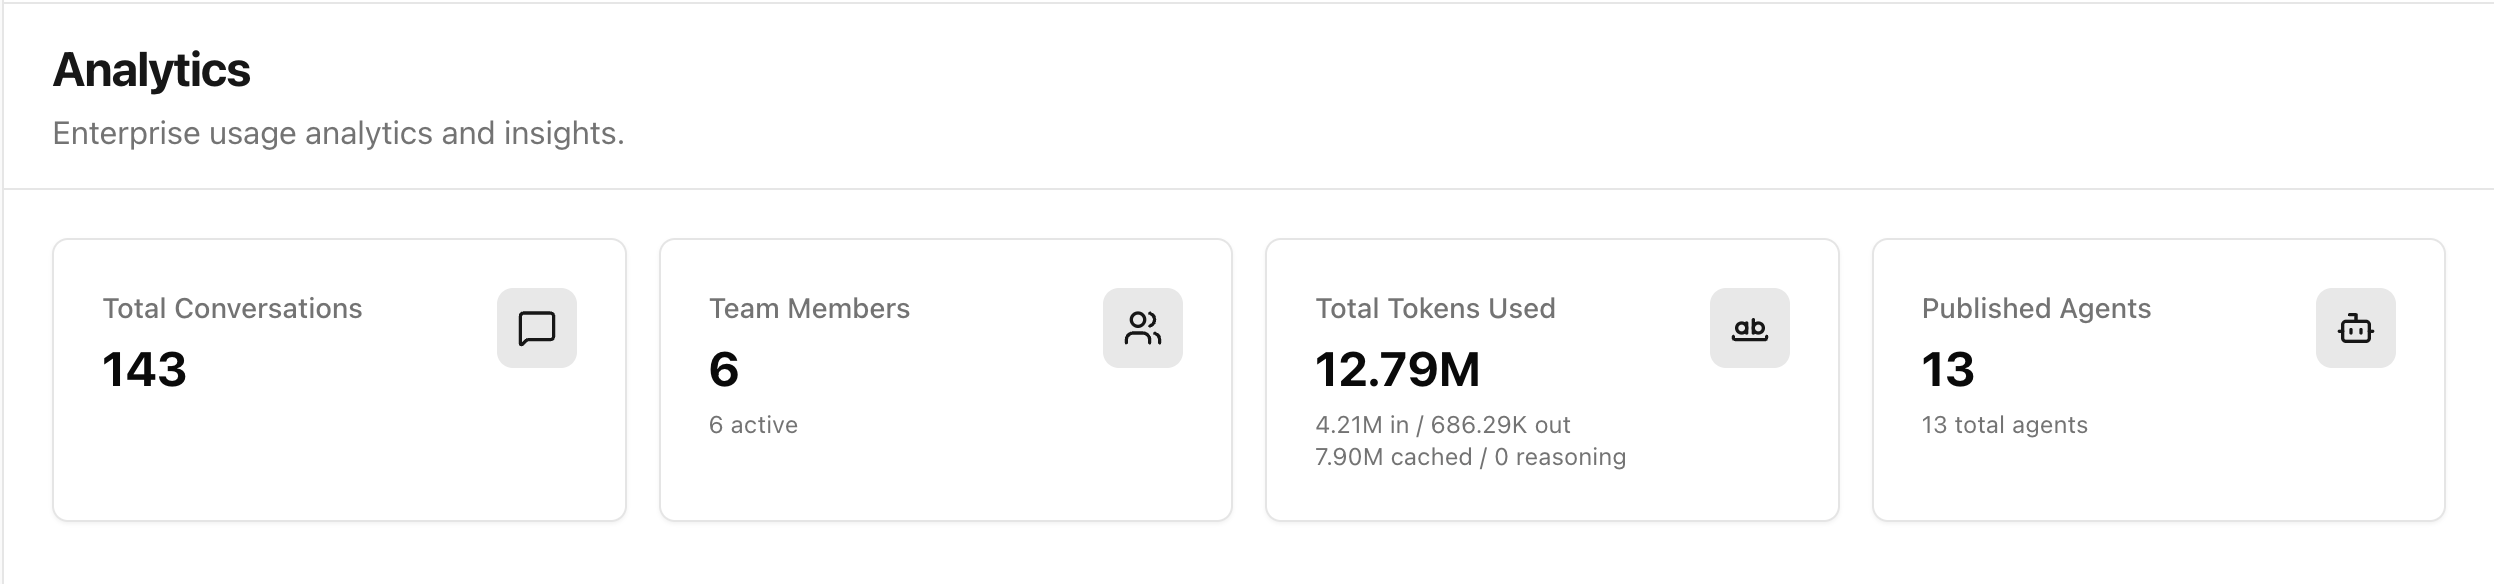
1. Quick Analytics
Quick analytics cards provide high-signal KPIs at a glance, including:
- Total conversations
- Team members (and active users)
- Total tokens used
- Published agents
Use these cards to spot growth, platform adoption, and sudden usage shifts.
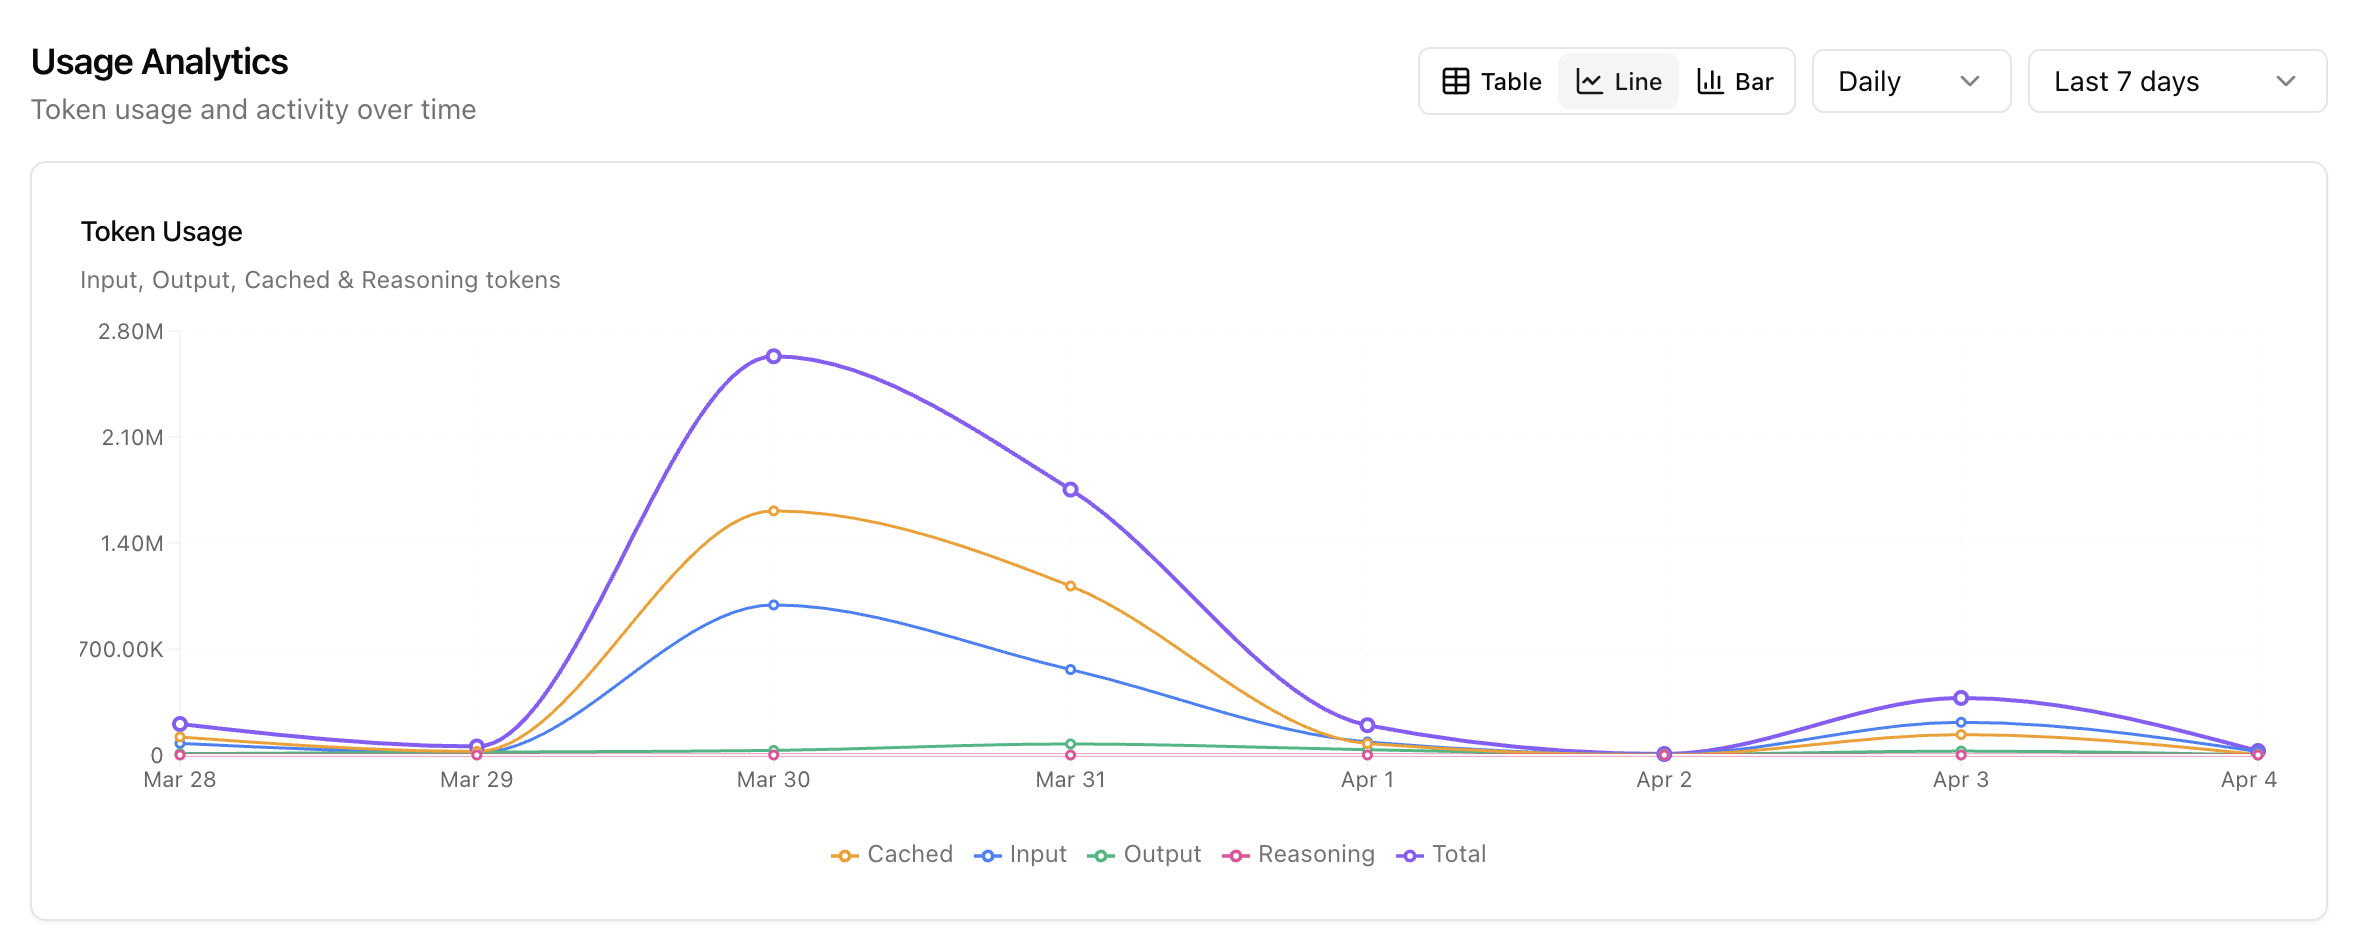
2. Token Usage Over Time
Track token activity over time to understand consumption patterns and model cost behavior.
This view helps admins identify usage spikes, quiet periods, and trends in input/output/cached/reasoning tokens.
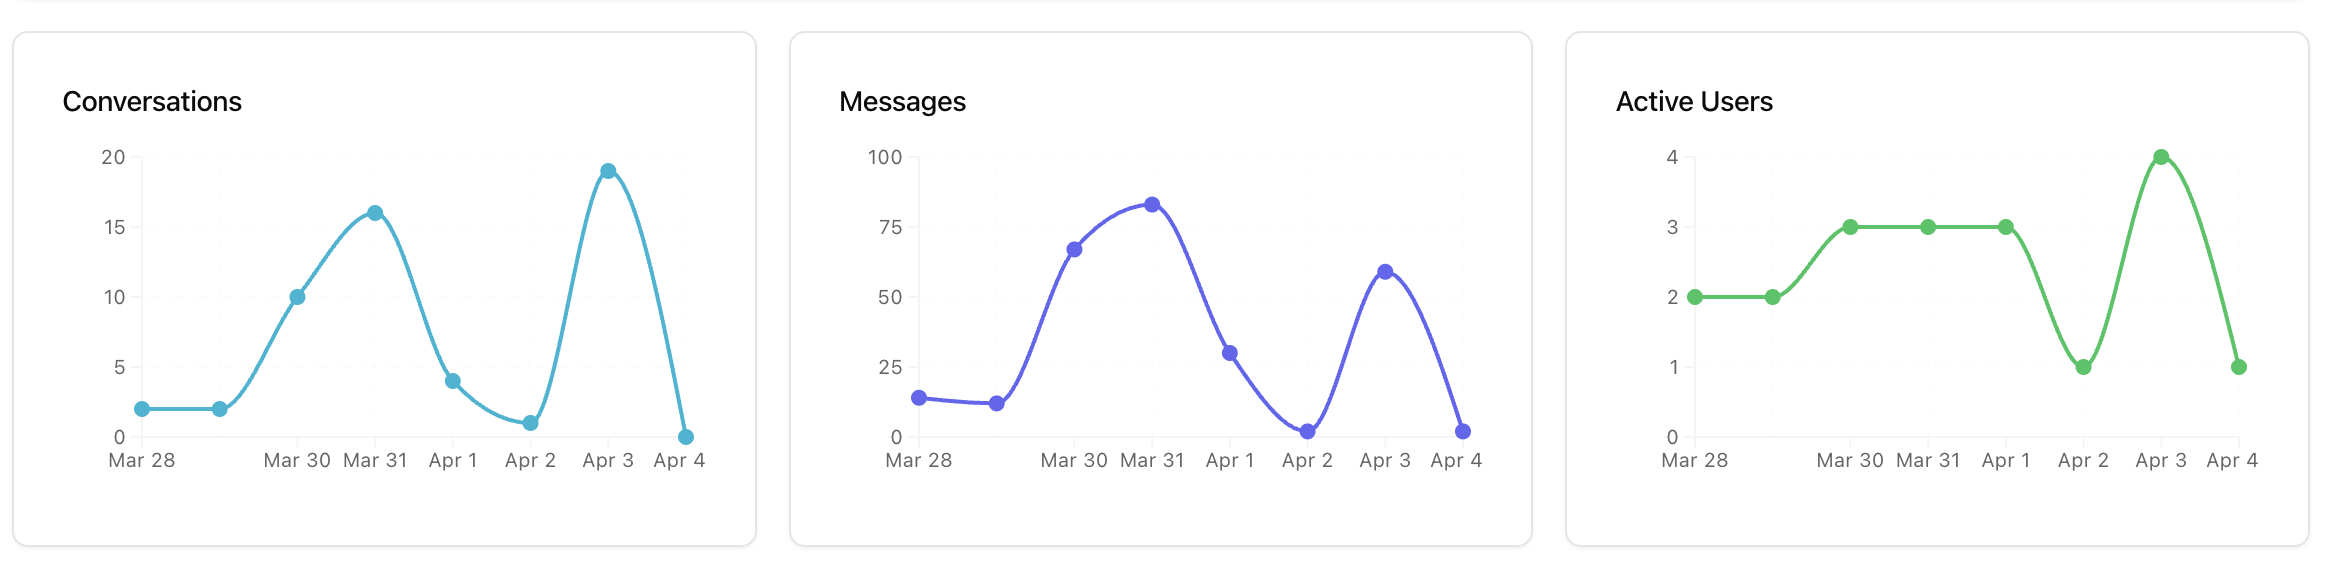
3. Conversation, Messages, and Users Trend Over Time
Monitor engagement trends across conversations, message volume, and active users.
Use this to evaluate team adoption and activity consistency over a selected period.
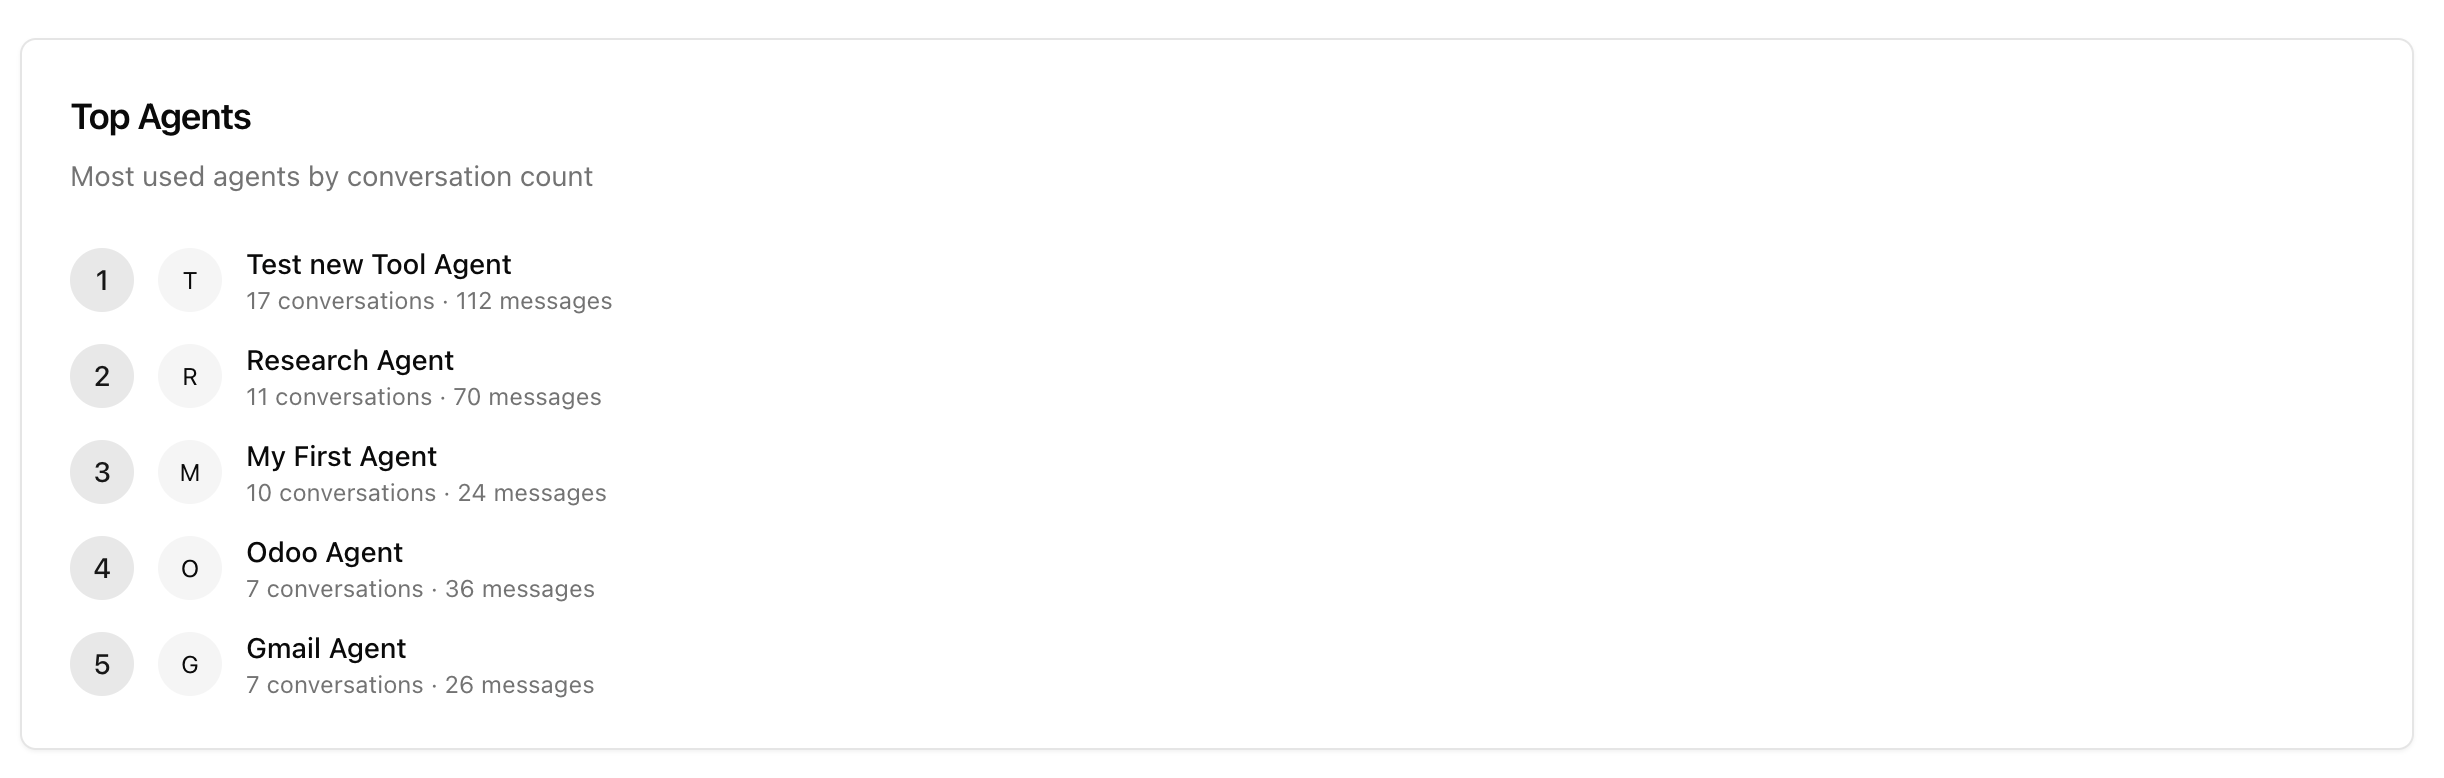
4. Top Agents Being Used
See which agents are used the most by conversation and message count.
This helps identify high-value agents, prioritize optimization, and guide rollout decisions.
Next Step
After reviewing usage insights, continue to Credits & Billing to manage credit operations and member balances.
Last updated: April 2, 2026